Weekly client reports
Apple device health summary, ticket activity, backup status, and system health for each client. Dark-themed or light, styled with gradient section dividers and status pills.

Weekly updates, monthly status reports, quarterly business reviews, and Mac hardware replacement analysis. Generated from live Apple fleet data, styled for clients, delivered by email.
Weekly, monthly, and quarterly Apple fleet reports built from your operational data. No manual spreadsheet assembly. Choose the report, choose the client, generate and send.
Apple device health summary, ticket activity, backup status, and system health for each client. Dark-themed or light, styled with gradient section dividers and status pills.
Broader operational view with uptime, disk health, and device compliance trends. Built from the same data pipeline as your weekly reports.
Full business review: ticket categorization, trend analysis, wins and highlights, hardware replacement forecasting, and actionable suggestions for the next quarter.
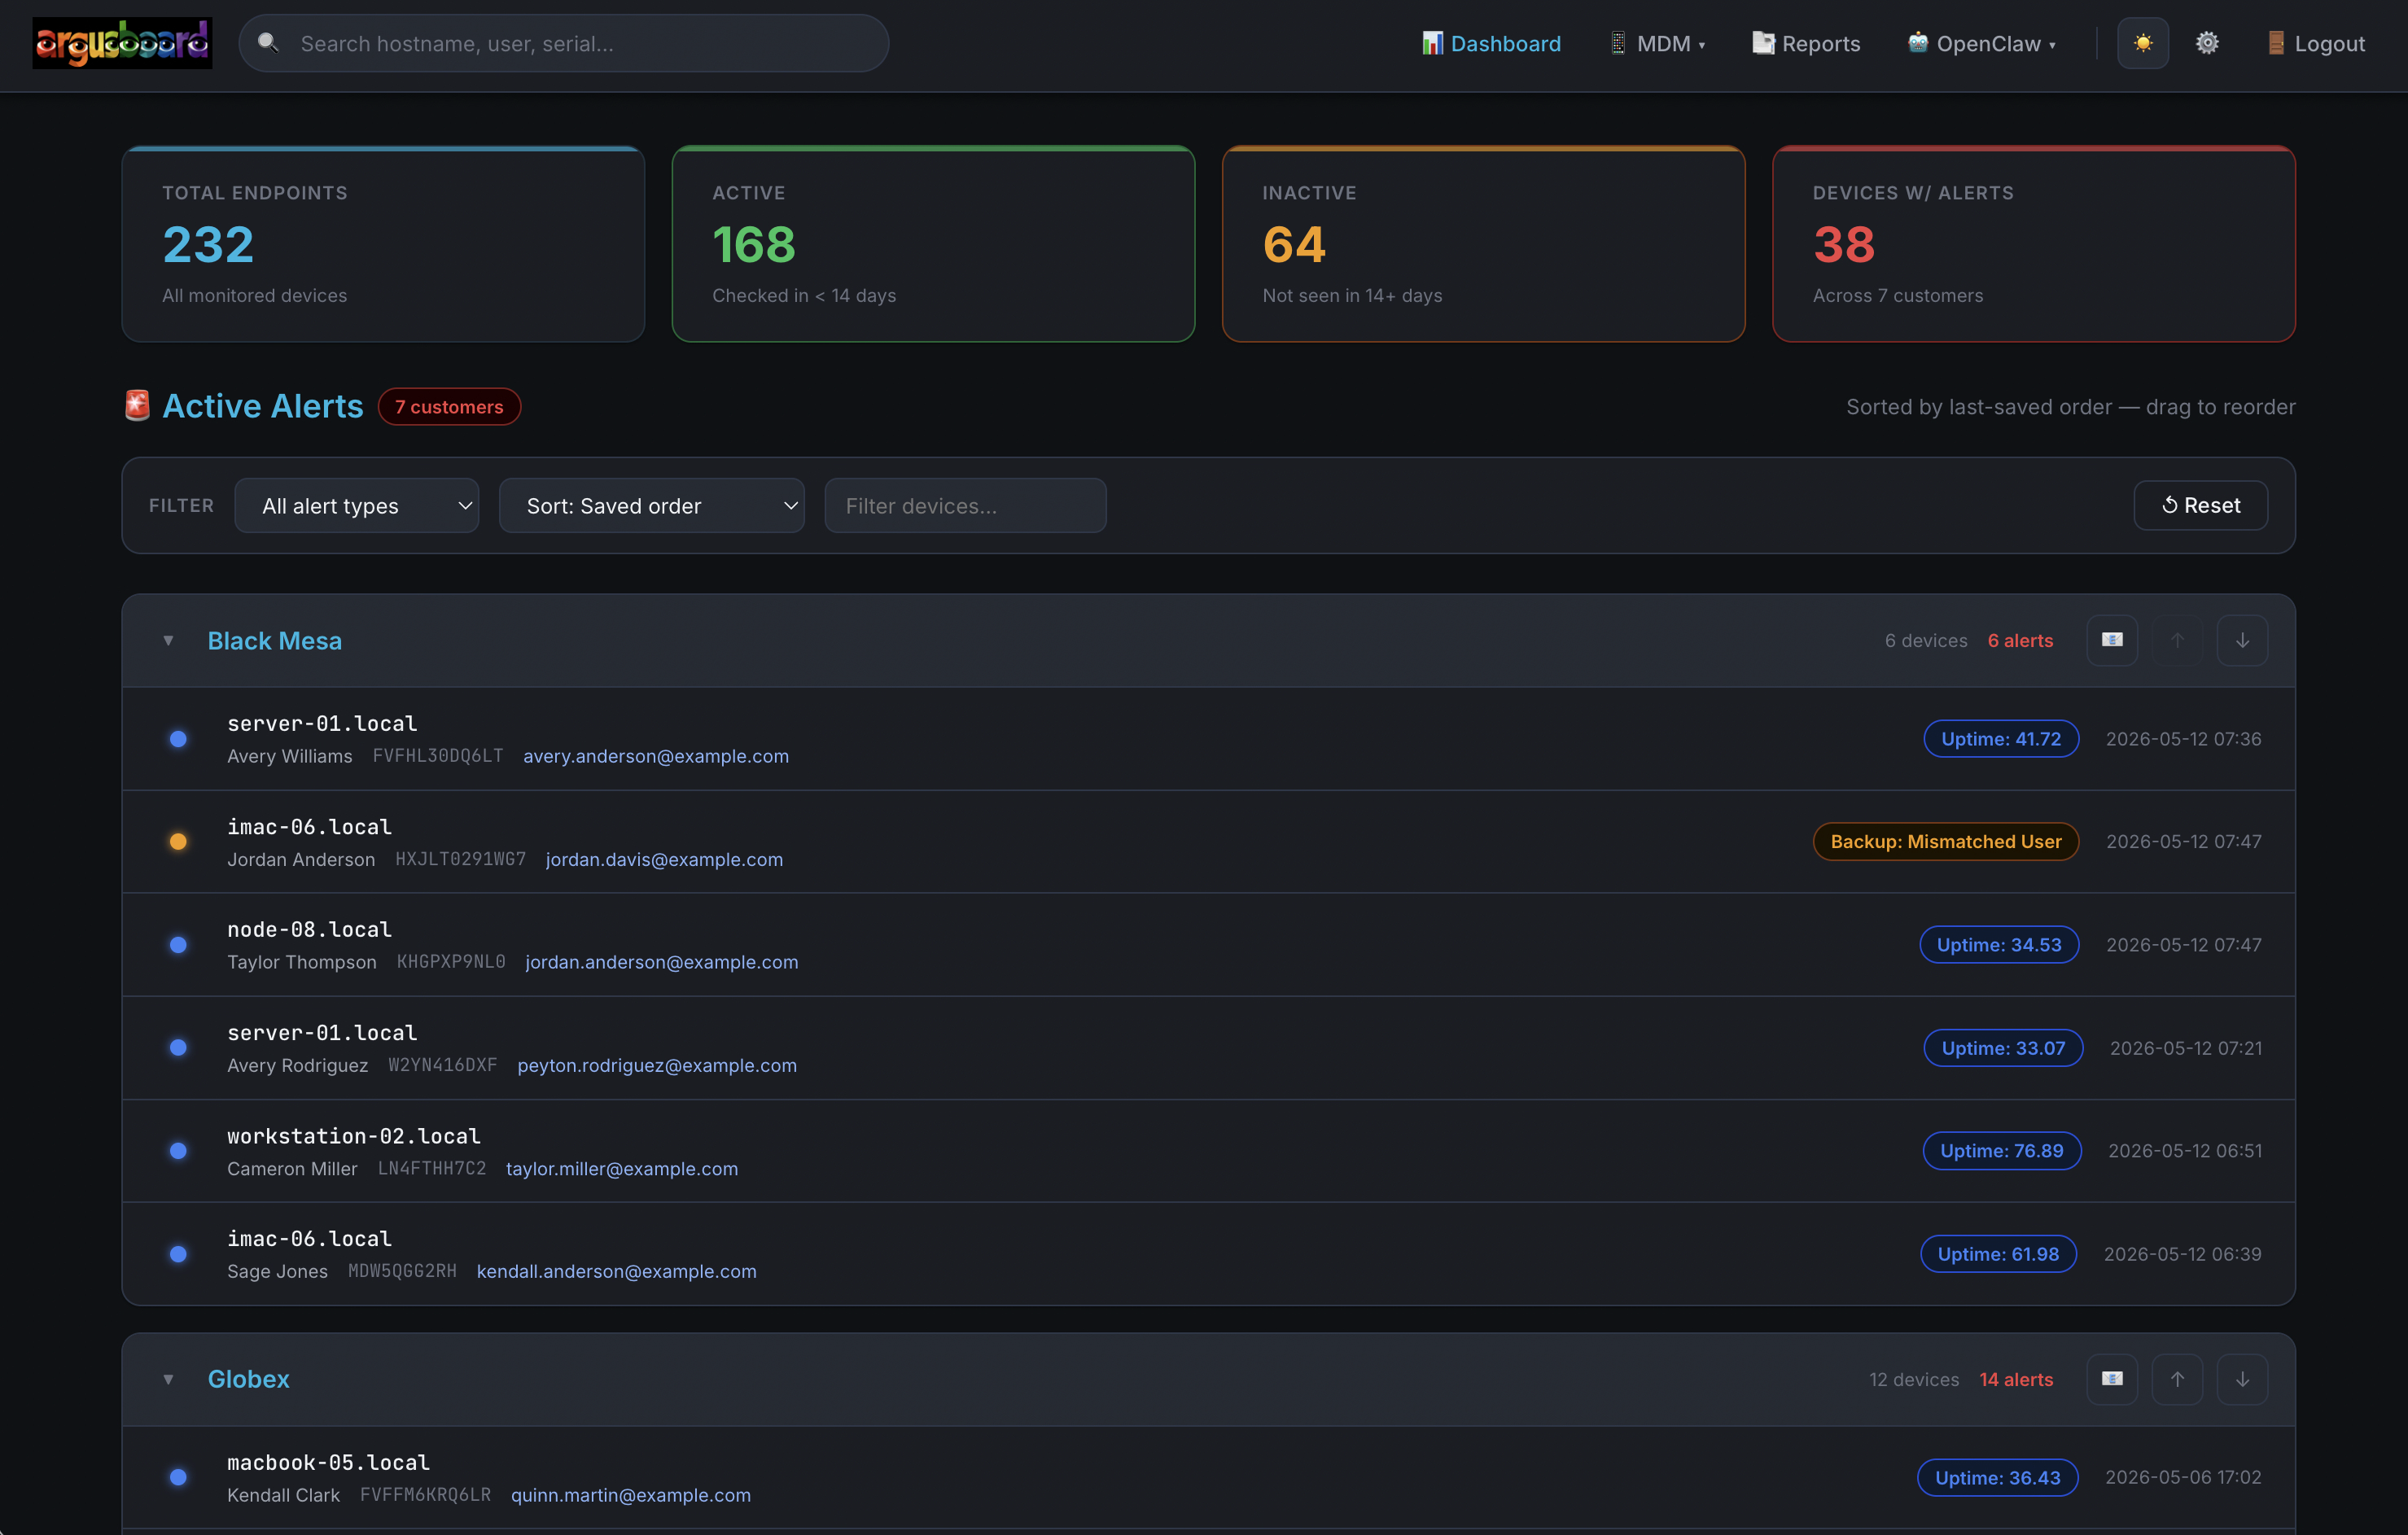
ArgusBoard dashboard
Your quarterly business review is the highest-value touchpoint with your clients. ArgusBoard generates the entire report from live Apple fleet data: ticket trends, Mac health, hardware replacement forecasts, and operational wins.
Generate, review, analyze, and email directly from the platform. No exporting to PowerPoint. No rebuilding every quarter.
Know which Macs need replacing before they fail. Apple Silicon vs. Intel identification, RAM checks, storage analysis, and color-coded classification for upgrade planning.
Physical memory reported in correct units. Storage capacity and usage tracked. Devices flagged when they fall below thresholds.
M1, M4 Pro, Intel i7. Apple Silicon and Intel chip names in hardware reports for clear upgrade planning conversations with clients.
Green, yellow, red classification visible on dark theme. Quick visual scan tells you which devices are fine, which are aging, and which need replacement now.
Cycle counts and health percentages tracked per device. Battery degradation alerts trigger before users start complaining.
Disk SMART status tracked across the fleet. Pre-failure warnings give you time to act before data loss.
Reports styled for client delivery. Professional formatting, clear language, actionable recommendations. Send directly from the platform.
Pull ticket data into your reports automatically. Status pills, requester info, activity timelines, and outstanding ticket tracking. Your reports tell the full story.
Apple fleet reports that look professional out of the box. Dark theme, clean typography, status pills, gradient dividers. Email delivery with branded sender identity.
Dark or light theme. Gradient section dividers, status pills, readable font weights. Reports that look like someone cared.
Color-coded status indicators for tickets, backups, and device health. Open = yellow, pending = orange, hold = blue, solved = grey. Visual clarity at a glance.
Send reports directly from ArgusBoard via SMTP. Branded "Copious Reports" sender identity. UTF-8 encoding for clean rendering everywhere.
Separate Weekly, Monthly, and Quarterly options in the report interface. Choose the client, choose the cadence, generate.
Grey N/A pills for reports that don't apply (e.g., no email-linked alerts). Clean presentation even when data is incomplete.
Report generation tied to the ArgusBoard scheduler. Failure tracking in status.json with email alerts on report generation failures.
Unified alert reporting across all clients. Missing endpoints, stale check-ins, hardware failures, and security exceptions surfaced in one place.
ArgusBoard includes an internal operations dashboard for monitoring the platform itself. Scheduler health, report generation status, and system architecture views.
AI agent usage tracking, cron run history, and session health. See what's running, what's scheduled, and what's consuming resources.
Live system architecture diagrams showing infrastructure components, integrations, and data flows.
Report generation scheduler with failure tracking, retry logic, and email alerts on failures. status.json dashboard visibility.
See how ArgusBoard turns your Apple fleet data into professional client deliverables, whether you're all-Apple or supplementing a Windows-first RMM.